Mapping Our Urbanism Part IV – Language
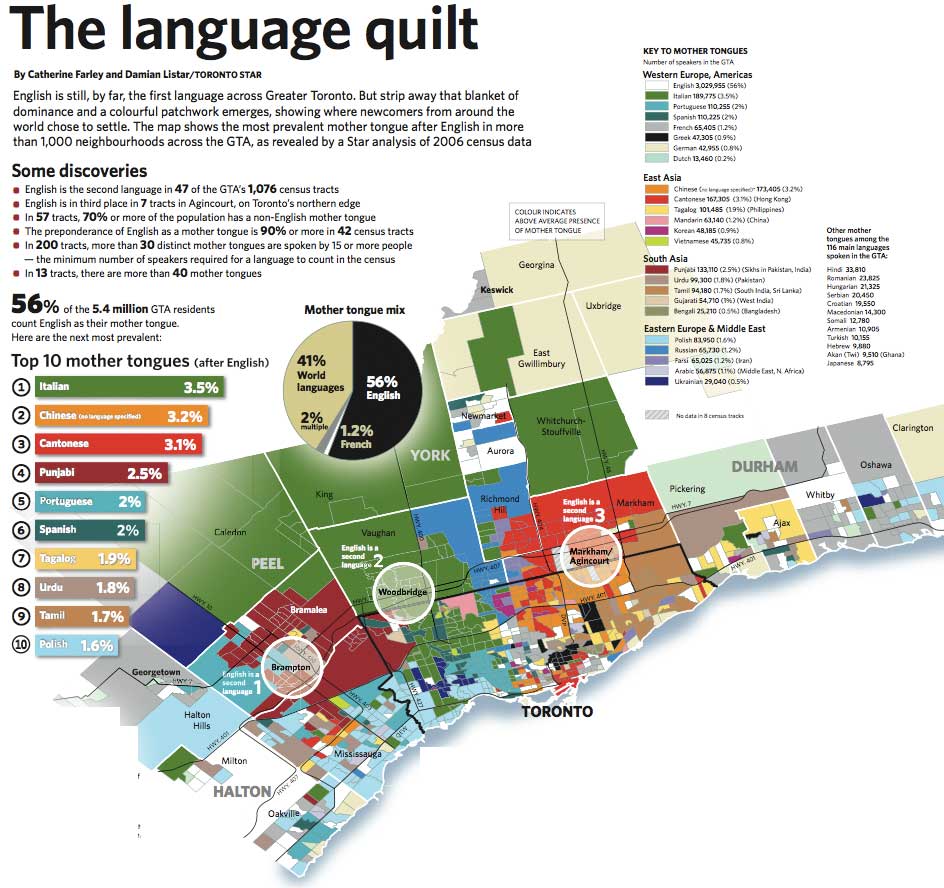
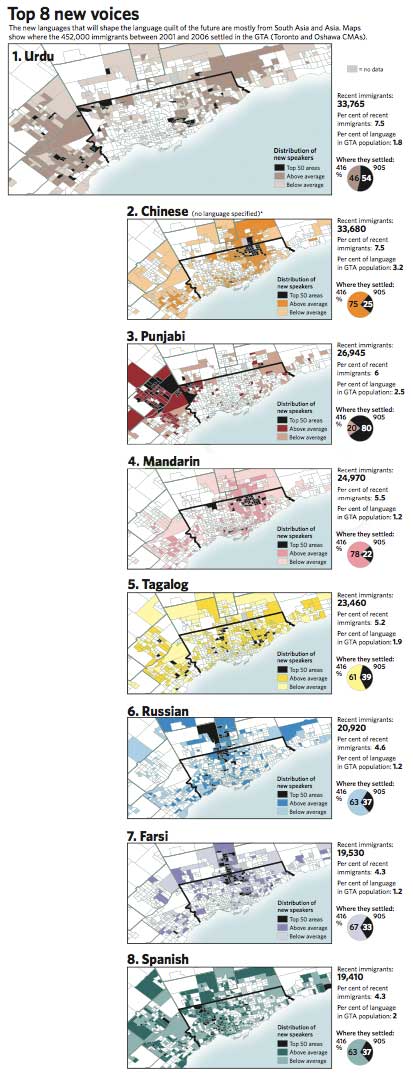
The Star included a map of “ The map is hidden away on their website in a massive (c. 20MB) pdf file (if you dare, here’s the link), so here are some more easily digestible images of the spread’s content (click to enlarge).
While we love to trumpet Toronto’s diversity, it’s nice to have some statistical proof to back up our claims. It’s pretty fascinating that the second largest language group in the GTA (by mother tongue) only represents 3.5% of the population, and yet with only 56% of the GTA reporting English as a mother tongue, the balance of 44% is made up of an incredibly diverse group of languages.
The Star describes their methodology for the creation of the main map (above):
BUILDING THE MAP OF SECOND LANGUAGES
Our challenge was to show the many language communities while retaining the areas where English overwhelmingly dominates:
– Only languages that ranked second in at least 5 census tracts are shown on the map.
– To replace English — the dominant language in 95% of census tracts — the second language must be above its GTA average.
– If languages were tied, the census tract was assigned to the language that was highest compared to its own GTA average, representing a more significant pocket.
Crossposted to spacing toronto as part IV of a series – to view the three earlier parts follow these links:
Mapping our urbanism part III – water mains
